


Oscillator Matrix vs Single Indicator: Which Is Better?
- afaq anser35
- Business
- 2026-11-03 19:53:36
- 2268K
Every trader eventually faces the same question. Should you trust one clean indicator, or should you combine several into an oscillator matrix? I have watched this debate play out on trading desks, in forums, and in my own charts for over two decades. The answer is rarely as simple as either side claims.
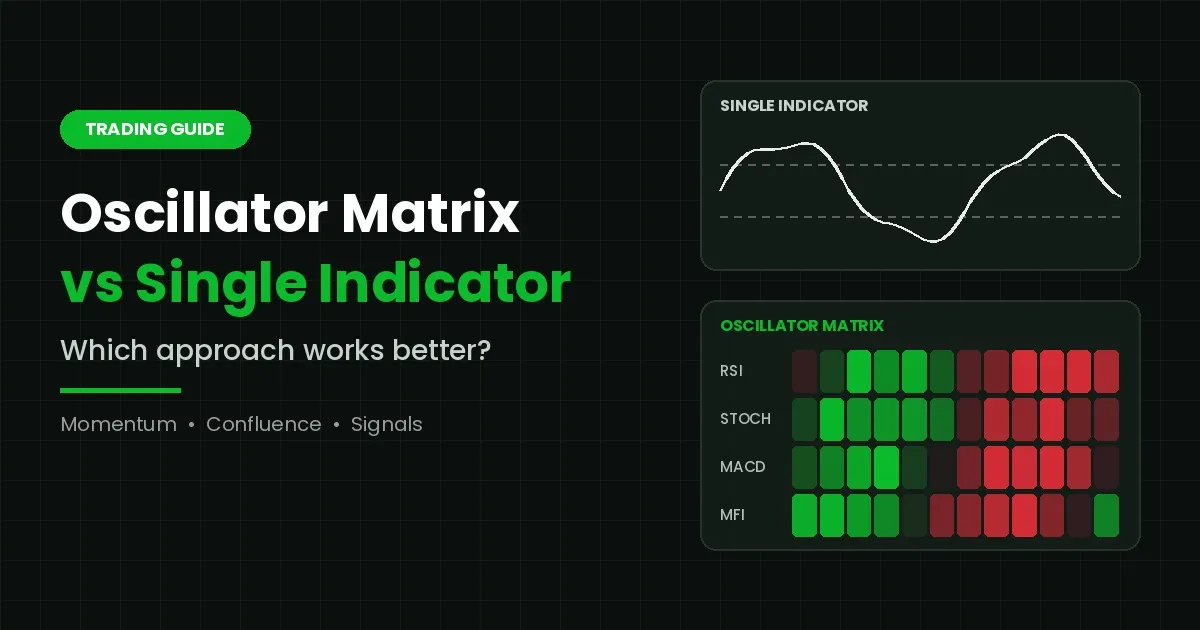
A single indicator offers clarity. You see one line, one signal, and one decision. However, markets are noisy, and one tool often misreads that noise. An oscillator matrix, on the other hand, blends several momentum indicators into one view. As a result, it can filter weak signals, but it can also slow you down.
In this guide, we will break down how each approach works. Next, we will look at where each one shines and where it fails. Finally, you will learn how to choose the right setup for your trading style. The goal is not to sell you a tool. Instead, the goal is to help you think more clearly about signals.
What Is a Single Indicator Approach?
A single indicator approach means you base decisions on one main tool. For example, a trader might rely only on the Relative Strength Index (RSI). When RSI rises above 70, the market is treated as overbought. When it drops below 30, it is treated as oversold.
This method has deep roots. In fact, many early technical analysts built entire careers around one or two tools. J. Welles Wilder introduced RSI in 1978, and George Lane popularised the Stochastic Oscillator around the same era. Both tools are still used daily by millions of traders.
How Momentum Indicators Work
Most oscillators belong to a family called momentum indicators. These tools measure the speed and strength of price changes rather than price itself. In simple terms, they ask one question: is the current move gaining or losing force?
Common momentum indicators include:
- RSI: measures the size of recent gains against recent losses on a 0 to 100 scale.
- Stochastic Oscillator: compares the closing price with its recent high-low range.
- MACD: tracks the gap between two moving averages to show shifts in trend strength.
- CCI: measures how far price has moved from its statistical average.
- Williams %R: shows where price closes within a recent range, much like Stochastic.
Each of these tools is useful on its own. However, each one is also built on a specific formula. That formula decides what the indicator sees and, more importantly, what it misses.
Why Traders Prefer One Indicator
Simplicity is the biggest draw. With one tool, your rules stay clear and easy to test. Moreover, you avoid the confusion of mixed signals. Beginners in particular benefit from learning one indicator deeply before adding more.
There is also a strong practical argument. A trader who truly understands RSI often beats a trader who loosely follows ten tools. Depth of knowledge, in my experience, matters more than the number of lines on a chart.
What Is an Oscillator Matrix?
An oscillator matrix is a framework that reads several oscillators at the same time. Instead of trusting one line, it checks whether multiple tools agree. Think of it as a panel of judges rather than a single referee.
A typical oscillator matrix might combine RSI, Stochastic, MACD, and a money flow measure. Each tool contributes its own reading. The matrix then shows where those readings line up and where they clash. Some versions display this as a heat map, while others produce a combined score or a set of confluence zones.
The Logic Behind Confluence
The core idea is confluence. When several independent tools point in the same direction, the signal is considered stronger. For instance, a bullish reading carries more weight if RSI is rising, Stochastic has crossed upward, and MACD momentum is expanding together.
However, there is an important catch. Many momentum indicators use similar inputs, mostly closing prices over a lookback period. Consequently, they can agree simply because they measure the same thing in slightly different ways. A well-built oscillator matrix accounts for this by mixing tools that capture different aspects of the market, such as momentum, volume, and volatility.
What a Good Matrix Shows
A useful oscillator matrix usually highlights three things:
- Direction: whether momentum leans bullish or bearish.
- Strength: how many components agree and how strongly.
- Divergence: where price and momentum start moving apart, which often warns of a turn.
When these three elements are presented clearly, a trader can judge a setup in seconds. When they are not, the matrix becomes just another cluttered panel.
Oscillator Matrix vs Single Indicator: The Core Differences
The oscillator matrix vs single indicator debate comes down to one trade-off. You are choosing between speed and confirmation. Let us look at how that plays out in real conditions.
Signal Quality and False Alarms
A single oscillator fires often. In a strong uptrend, for example, RSI can stay above 70 for weeks. A trader who sells every overbought reading will keep fighting the trend. This is one of the most common and costly mistakes I have seen.
An oscillator matrix reduces this problem. Because it waits for several tools to agree, many weak signals are filtered out. Therefore, the trader takes fewer trades, but each one tends to carry more context.
Speed and Lag
On the other hand, confirmation has a price. Every extra filter adds delay. By the time four tools agree, part of the move may already be gone. Fast scalpers often find this lag frustrating.
A single indicator, in contrast, reacts quickly. If you trade short time frames, that speed can matter more than precision. Still, speed without a filter can lead to overtrading.
Clarity and Decision Fatigue
One indicator is easy to read. You glance at it and know where you stand. Meanwhile, a poorly designed matrix can bury you in conflicting data. Too many inputs often lead to hesitation, and hesitation leads to missed entries or late exits.
That said, a clean oscillator matrix can actually reduce decision fatigue. When the tools are summarised into one clear reading, the trader no longer has to check five separate panels. The key word here is clean.
Adaptability Across Markets
Markets change character. A tool that works well in a range may fail badly in a trend. A single indicator is usually tuned for one type of condition. As a result, it struggles when the market shifts.
A matrix offers more balance. Since some components handle trends better and others handle ranges better, the combined view adapts more smoothly. Nevertheless, no combination works in every market, and testing is always required.
When Each Approach Works Better
There is no universal winner. Instead, the better approach depends on your goals, your time frame, and your experience.
A Single Indicator Suits You If…
- You are new to trading and still learning how momentum behaves.
- You scalp or trade very short time frames where speed is vital.
- You prefer simple rules that are easy to backtest.
- You already pair your indicator with price action or support and resistance.
An Oscillator Matrix Suits You If…
- You trade swing or position setups and can afford a little lag.
- You are tired of false signals from one tool.
- You want a structured way to confirm entries and exits.
- You trade several markets and need a view that adapts to changing conditions.
How to Build a Reliable Oscillator Matrix
If you decide to use an oscillator matrix, structure matters. Here is the process I have refined over many years.
- Pick tools that measure different things. Combine momentum, volume, and volatility instead of stacking three similar oscillators.
- Keep it small. Three to five components are usually enough. Beyond that, you add noise rather than insight.
- Define clear rules. Decide in advance how many tools must agree before you act.
- Respect the trend. Use a higher time frame or trend filter so you do not fight the main direction.
- Test before trusting. Backtest and then forward test on a demo account. Results should be judged over many trades, not a handful.
Common Mistakes to Avoid
Even experienced traders fall into a few traps. First, many confuse correlation with confirmation. If RSI and Stochastic agree, that is not two signals; it is often one signal shown twice.
Second, some traders keep adding indicators after every loss. This habit, often called indicator overload, creates more confusion, not more accuracy. Third, traders often ignore risk management. No oscillator matrix or single indicator can replace a sensible stop loss and position size.
Finally, avoid treating any tool as a crystal ball. Indicators describe what price has done. They do not promise what price will do next. Keeping that mindset protects both your capital and your confidence.
So, Which Approach Works Better?
In my experience, the answer leans toward a well-designed oscillator matrix for most swing traders. It filters noise, adds context, and adapts better to changing markets. However, a single indicator remains a powerful choice for beginners and fast traders who value clarity and speed.
Ultimately, the best approach is the one you understand deeply and apply with discipline. Start simple, learn how momentum indicators behave, and add confirmation only when it truly improves your results.
Final Thoughts
Choosing between an oscillator matrix and a single indicator is less about tools and more about process. Whichever path you take, test it honestly and judge it on real results. Many traders who research GainzAlgo first ask, "is GainzAlgo legit?" That is a smart question to ask about any trading tool. In the same spirit, look for transparent methods, realistic expectations, and clear explanations of how signals are formed. Those qualities, rather than bold promises, are what make any indicator approach worth your time.
2268 people like this


About Premium Author
This post has been authored and published by one of our premium contributors, who are experts in their fields. They bring high-quality, well-researched content that adds significant value to our platform.
Leave a Reply
Please login to post a comment.






0 Comments